Geospatial Measurement Solutions, LLC: Custom software development; database maintenance and development; remote sensing analysis, data collection, mobile technology implementation, and scientific analysis and documentation.
Wildland-Urban Interface (WUI) and Wildland Fire Data Collection (National Institute of Standards and Technology Fire Research Grant 60NANB11D173)
SPATIOTEMPORAL WUI AND WILDLAND DATA COLLECTION
Data collection techniques in WUI and wildland environments involves capturing spatiotemporal information (i.e., fuels, topography, weather coupled with sensing of during fire behavior and the human actions occurring during the fire) at various scales depending on the purpose of the data collection event. The Fire Disturbance Continuum as described by Jain et al (2004) provides a framework to understand the temporal aspects of the data to potentially be collected regarding the WUI and wildlands. This section examines various geospatial technologies and techniques for enhanced collection of WUI and wildland fire information. Remote Sensing science and technology might also allow for significant advances in WUI and wildland data collection and is discussed in the WUI Remote Sensing Section. The Fire Disturbance Continuum can be used to highlight the spatiotemporal aspects of data required for WUI and wildland fire data collection as shown in the table below. The quantity and quality of information collected in each fire environment will guide the information that can be concluded regarding any fire assessment. The difficulty in acquiring certain data listed in the table below hinders current advancement in the fire sciences regarding understanding of WUI and wildland environments. The type of information described in the table below pertains to all studied fire environments from WUI to wildland to prescribed fires. Table 1: Key characteristics to assessed and general assessment methods for various environments found in the Fire Disturbance Continuum.
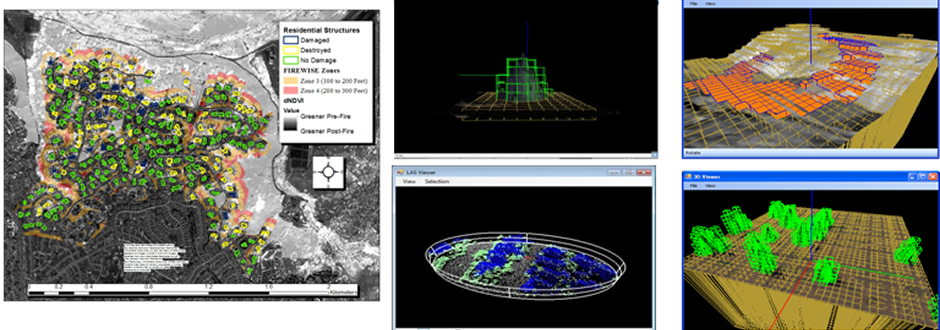
Furthermore, the information shown in the above table often is required to be acquired at different scales. For example, collection of general statistics on WUI destruction to primary structures is useful on a national scale such as is shown in the web mapping application portrayed in Figure 4 above. Also, collection of fine scale WUI damage and destruction information obtained through scientific data collection (e.g. Maranghides and McNamara, 2016) is also useful. Fine scale WUI damage information at the structure component level might provide the most useful information regarding structure vulnerabilities to WUI fires, if taken in context of exposure conditions. Finally, advances in understanding fire behavior and meteorology involve capturing extensive information regarding characteristics of smoke plumes, wind measurements, fire behavior and energy, fuels and other component processes and fire behavior characteristics at multiple scales in the active fire environment. Some fire environments do provide opportunities for data collection of pertinent characteristics. For example, the pre-fire environment is often assessed by local tax authorities and information is recorded detailing certain aspects of the built environment (e.g. roof cover type) on a parcel or property basis. The degree of information collected regarding the built environment and the variability of publicly available information varies from state to state and often within a state at the county or city level. Other fire environments present greater challenges. It is extremely difficult, for example, to characterize WUI active-fire behavior. Below are detailed various geospatial science and technology applications for improving data collection in WUI and wildland environments. Remote sensingAdvances in remote sensing have provided untapped resources for the assessment of WUI and Wildland environments. Pertinent characteristics of every time period in the Fire Disturbance Continuum can be mapped to a lesser or greater extent using remote sensing. Expertise in this technology, however, is sometimes required for full utilization of remote sensing to assess the WUI and wildlands. Remote sensing in the WUI and wildlands is detailed in this section. Remote sensing technologies can provide valuable information regarding certain aspects of the built environment. Some form of ground assessment will always be required because of occluded building features (e.g. windows) and difficulties in determining building material as well as validating other remote sensing techniques. Remote sensing, however, is the only reasonable means of collecting landscape characteristics of wildlands and residential vegetation over significant areas. Mobile Data Collection
Ground data collection can use either paper based or electronic methods. There are both advantages and disadvantages to paper versus electronic data collection methods. A comparison of advantages and disadvantages of each technique can be examined in "Digital Data Collection Vs. Data Collection on Paper". In regards to post-fire assessments, particularly local assessments after a WUI incident, paper is the dominant data collection method utilized to date. This is likely in no small part due to the lack of existing systems and the need to rapidly collect information to respond to the disaster. Lack of training, infrastructure costs and other factors remain as hindrances to wide spread adoption of electronic data collection, particularly regarding post-fire WUI assessments. Nonetheless, the result is little local or regional information on fine scale WUI damage and destruction over significant temporal extents available to researchers and policy makers. These paper based assessments of post-fire WUI incidents often do not translate into data repositories of WUI damage and destruction and are typically only used for immediate response to the incident (e.g. providing homeowners the necessary information for safe re-entry into the community). Typically, at best, the end result might be an evaluation paper with no reference to a location where the actual data is stored for researchers, policy makers or interested citizens. Monitoring of WUI damage and destruction at relevant spatial scales, therefore, does not generally exist over significant temporal extents. Mobile data technology, however, has become prevalent across the world and the next generation of local government staff will likely be quite familiar with the use of this technology. The prevalence of mobile technology has resulted in numerous applications to collect and distribute data via mobile devices. Nonetheless, many of these applications still require underlying expertise in GIS or other technologies to implement the system for data collectors and to manage data. In order to address the need for electronic data collection for WUI and wildland fire environments by those not trained in geospatial science and technology, a simple data collection (iGeoData) and data dissemination application was developed for the iOS™, capable of being implemented on iPods™, iPhones™ and iPads™. Additionally, an application to create and distribute custom data collection schemas was created (iGeoSchema). The iGeoData application allows for the following key functionality:
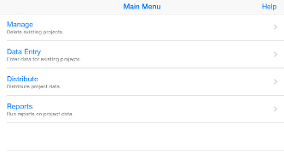
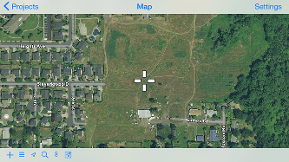
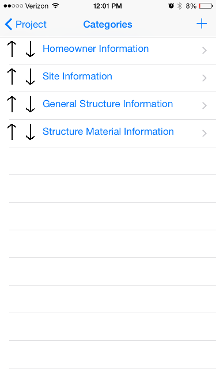
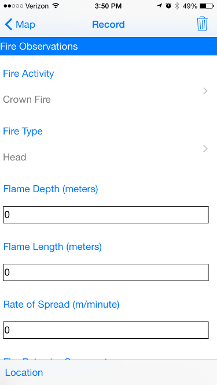
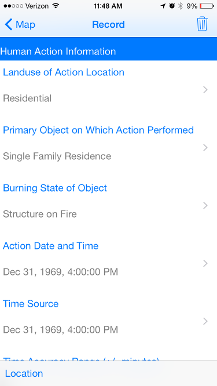
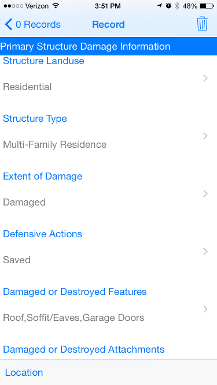
Figure 5 below shows key screens associated with the iGeoData application.
Figure 7. Screen shots of the iGeoData and iGeoSchema applications for custom data collection. The Data Entry section of the app facilitates the following key functional requirements:
Data can be displayed as a tabular report or as a list report as shown in Figure 5 above. The iGeoSchema application allows users to create custom data collection schemas and distribute among different devices for consistent data collection within a team. Multiple data collection schemas can be created, distributed and used on multiple devices with integration possible from files stored within various other apps (e.g. Box, Google Drive, email, AirDrop). Data can be exported in KML and CSV format for integration with other applications. The apps described above provide a simple means for damage assessments after any disaster and can be used for any point based data collection. Numerous other applications exist. In fact, the application can be used for pre-fire WUI and wildland assessments both to highlight mitigation opportunities and as a base to efficiently and effectively respond to disasters. Custom configurations support multiple field type choices (e.g. text, number, image, date or pick list) and fields can be set to be repeating to reduce duplication in data entry. The above demonstrates a simple solution for basic data collection. Other more complex solutions can and do exist and should be used as appropriate. Examples of different types of systems used for field data collection include:
Numerous other applications also exist for mobile data collection but again, most are either relatively expensive and/or require expertise in GIS. The above described applications all allow for collection of WUI and wildland fire related data throughout the temporal extents described in the Fire Disturbance Continuum. Compiling and disseminating the information in a usable format to derive information pertinent to mitigating the WUI and wildland fire problems is more difficult. As discussed in Web Map 3 above, the NFIRS database provides a consistent format to record information on damage to WUI and wildland fires. Many of the applications described above could be configured to collect data in a consistent format to populate the NFIRS database, which also does have a web based data entry tool. Additionally, mobile data collection can help to derive more accuracte numbers for population of the SIT-209 database, described in the web mapping application shown in Figure 4 above. Nonetheless, no standardized databases used across the US exist for recording damage to structural vulnerabilities. Consistent databases to store community type data collected through processes discussed in Maranghides and McNamara (2016) are also lacking. Much of the data required to fully categorize the Fire Disturbance Continuum is lacking. Additionally, consistent methods to record local fire knowledge in a geographic manner over time also do not exist. Mobile data collection can only go so far in addressing some of these issues. Collection and universal distribution of the above described information presents many logisitical constraints. Ultimately, experiments and modeling are required to integrate data collected with mobile and other technologies to gain a better understanding of fire behavior and the component processes governing that behavior. Even when logisitically possible acquiring data to populate the above databases is often difficult and time consuming. Even identifying appropriate locations for outdoor field experiments is difficult due to lack of a system to record, store and disseminate local knowledge. Crowd sourcing technologies implemented on various devices can aid in recording of key information required for improving understanding of the WUI and wildland fire problems. As a proof of concept, the iGeoSchema application comes pre-configured with several data collection schemas as follows:
Figure 6. Examples of the WUI Homeowner Structure Mapping schema file, Fire Behavior Observations Form, First Responder Actions Form, and NIST WUI 1 Form for field data collection and crowd sourcing created with iGeoSchema and viewed in iGeoData. The above schemas are examples and ultimately it is recommended for all local fire agencies to record fire damage information in the NFIRS database. Having this information readily available to researchers will go far in producing more efficient and effective post-fire assessments. For example, having local fire departments record information in NFIRS could have saved significant amounts of time in assessment of the Waldo Canyon Fire where 4500 person hours were utilized to gather this information (Maranghides et al 2015). Some of the key information used for the assessment of the Waldo Canyon Fire regarding human actions could have been recorded in the NFIRS database. The above example database schemas can facilitate the recording of the information required to populate the NFIRS database for WUI events like the Waldo Canyon Fire as well as recording of more detailed information to aid in assessment of WUI events. WUI mitigation advice
Local fire department also at times have rating systems applied to WUI communities where building information is collected. Collection of information regarding the built environment is then limited by access to the property and funds available for assessment. Crowd sourcing technologies could be used to facilitate collection of building information but prevalent use by homeowners might not occur. Ultimately, building codes and standards could help drive information required for assessment in WUI communities by local authorities and requirements for collecting information on the built environment. |
©2013 Geospatial Measurement Solutions, LLC - 2149 Cascade Ave. Ste. 106A PMB 240 Hood River, OR 97031, USA 541-436-4486 dmgeo@gmsgis.com