Remote sensing provides many opportunities for assessment and derivation of products to describe the pre-fire environment. Fire model inputs of fuels must be derived before the fire. Additionally, in context of post-fire WUI assessments, building material must also be determined before the fire, typically for destroyed structures. Other key inputs to fire models such as meterological conditions must come from the active fire environment. In theory, assumming no change, terrain can be derived at any time during the Fire Disturbance Continuum. Active fire measurements of course must occur during the active fire environment.
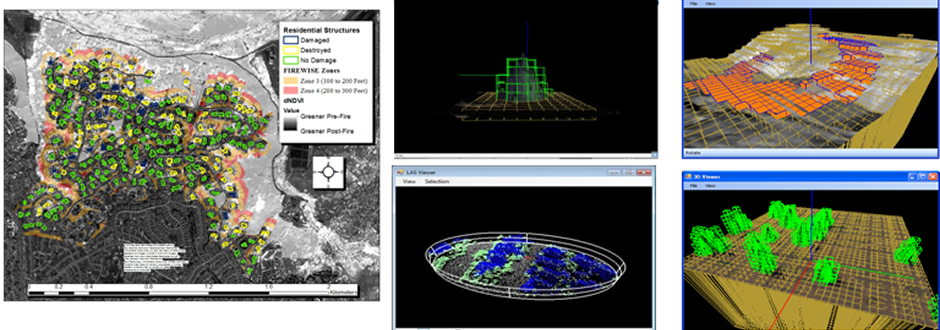
This project utilized remote sensing to assess both building material and the spatial extent of vegetation in WUI and wildland environments. Building material was extracted from Google Earth Streetview™ ground imagery and vegetation was extracted from Light Intensity Detection and Ranging and unmanned aerial system (UAS) remotely sensed imagery. These applications represent examples of the use of remote sensing in assessing the pre-fire environment for WUI and wildland locations.
Extracting Roofing Material from Google Earth Imagery
Roof material has been shown to have consequences for structure survival in WUI fire environments (Maranghides et al., 2013). Assessment of roofing material for fire consumed structures in a post-fire environment is often not completely possible without prior knowledge. Often times tax assessors provide information on building material but limited funds and changes in roofing material over time make it difficult for these assessments to always be accuracte after a post-fire WUI assessment. Google Earth Streetview™ imagery provides a clear view of roofing material whens structures are relatively close to the street. Fortuitously for this excercise, the 2012 Waldo Canyon Fire had Google Earth Streetview™ imagery of the Mountain Shadows Community (MSC) collected one year before the fire in August of 2011. This represented the most up to date information on roofing material for MSC, in theory.
|
Consequently, the primary residential structures found within MSC where classified for roof cover type as shown in Table 1. An assessment of the accuracy of these remote sensing roof cover type classifications was conducted by randomly sampling 25-30 primary structures from each of the roof classifications made from Google Streetview™ and shown in Table 1. This resulted in 114 primary structures to field assess for roof type. Of these 114 primary structures, three could not be determined in the field, resulting in a total of 111 samples. Roofs were sampled using custom data collection tools developed for this project and implemented in the field by Bob Vihnanek and Joseph Restaino of the Fire and Environmental Research ApplicationsTeam (FERA) in the summer of 2013.
|
| Table 1: MSC Roof Cover Type Classifications |
| Roof Cover Type Classification |
|
Asphalt
|
| Flat Tile |
| Round Tile |
| Wood Shake |
|
The results of the accuracy assessment are shown in the confusion matrix portrayed in Table 2. The overall accuracy of the classification is 92.8% resulting in a Kappa statistic of 0.904. Though there is not a standardized method for interpretation of the Kappa statistic, Landis and Koch (1977) considers a Kappa statistic between 0.81-1 as almost perfect. Overall, the results are quite good and in fact better than indicated in Table 2 and the overall classification accuracy and Kappa statistic shown above due to roof cover type changes between the Waldo Canyon Fire and the time of the field assessment conducted in 2013.
For example, as can be seen in Table 2, there were four Google Streetview™ wood shake shingle roofs, three of which were found to have an asphalt covering and one a round tile covering during the 2013 field assessment. In every case, through examination of post-fire imagery taken on June 28, 2012 and Bing Maps™ imagery taken in 2015, changes in roof type are evident, confirming these primary structures had wood shake shingle roofs at the time of the fire and the incorrect classification shown in Table 2 are only a result of the field assessments occurring after the fire. Consequently, for the wood shake shingle roof cover type classification there are 0% errors of omission (i.e., classifications that failed to result in the proper class) as well as 0% errors of commission (i.e., classifications that represent pixels that belong to another class that are classified as occurring in the classification of interest).
Table 2. Accuracy assessment of Google Streetview™ roof cover type classifications.
Google Streetview™ Classified Roof Type
|
Field Sampled Roof Type
|
| Wood |
Asphalt |
Round Tile
|
Flat Tile |
Total |
Omissions
(%)
|
Commissions
(%)
|
| Wood |
21 |
3 |
1 |
0 |
25 |
16.0% |
0.0% |
| Asphalt |
0 |
26 |
0 |
1 |
27 |
3.7% |
18.8% |
| Round Tile |
0 |
0 |
28 |
0 |
28 |
0.0% |
3.4% |
| Flat Tile |
0 |
3 |
0 |
28 |
31 |
9.7% |
3.4% |
| Total |
21 |
32 |
29 |
29 |
111 |
|
There were, however, some omission and commission errors present for the asphalt roof cover type classification. Two of the errors of omission resulting in Google Streetview™ classifications incorrectly classifying asphalt roofs as flat tile are clear errors. Second examination in Google Streetview™ clearly shows these as asphalt roofs and these errors might simply be a result of data entry error, which is always possible, but shown here to be relatively small. One of the errors of omission resulting in Google Streetview™ classifications incorrectly classifying an asphalt roof as flat tile was where there were only partial views of the structure from the street.
The one error of commission resulting in a flat tile roof being classified as an asphalt roof is also an error. This primary structure was further from the street and might have been a cause of the error. The above points out the shortcoming associated with Google Streetview™ in that it can only be used to classify primary structures relatively close to the street. The exact distance when classifications become more incorrect is not assessed in this study.
Google Streetview™ will not always be available for all sistuations but demonstrated above is a technique for post-fire assessments that alleviates the need to assess all structures for building material properties in the field, post-fire. Given that a post-fire environment will always have a significant portion of the population where all building material properties cannot be determined (i.e. destroyed primary structures) and that these properties must come from a pre-fire source, such as Google Streetview™ when available or local tax assessor data, post-fire assessment should simply assess an appropriate sample population of non-damaged structures to determine accuracy of the pre-fire data and appropriate uses.
Vegetation Extraction from UAS Pre-Fire Imagery
Pre-fire imagery was the only method for deriving fuel inputs for the 2014 Camp Swift Research Burns. Tools and techniques used for fuels derviation at the Camp Swift Research Burns are described in more detail at:
Key lessons learned from the above effort are as follows:
- Perform Camera Calibration: imagery from off-the shelf digital cameras might have distortion requiring the need for a camera calibration to determine the camera's interior orientation parameters. Calibration of visible and thermal video imagery might be conducted by placing grid patterns of ground control in a field and flying the UAV with the visible and thermal videos.
- Synchronize Camera Time and GPS Time: synchronization of the camera time with the GPS time will facilitate the creation of orthoimage products.
- Extend Ground Control Beyond Plots: extending the ground control beyond the plots and throughout the image acquisition area will aid in the quality of the ortho products produced.
- Use Smaller Ground Control for Still Images: fire shelters were established as ground control for visible video and were the only features available to use to georectify the DSLR imagery. Smaller ground control features (e.g. small boards with painted X's) could be utilized and more easily deployed across the study area of interest for DSLR imagery. Ensure the ground control is visible in the relevant sensor. These will also represent more spatially accurate ground control for high resolution DSLR imagery compared to fire shelters.
- Place Thermal Ground Control Further from Plot Edge: the thermal ground control became saturated as the fire approached these areas. Placing these further from the plot edge might reduce this effect.
- Place Ground Control within Plot: ground control within the plot will provide important data for validation. While thermal ground control within the plot might not be possible due to the possibility of it igniting the plot, visible video ground control could help validate locations of thermal video sensed heat release.
- Place Ground Control Evenly Around Plot: more ground control was placed on the east and west sides of the plots compared to the north and south. Taking some ground control from the east and west sides and moving to the north and south will present a better geometric arrangement of ground control for georectification or orthorectification.
- Determine Ground Sample Distance of Sensors: determine the ground sample distance of various sensors at various flying altitudes.
- Perform Quality Control of Imagery: a large advantage of a UAS over a fixed wing system is the ability to easily have multiple flights. Operators should perform established quality control procedures on collected images to quickly identify issues and re-fly as necessary. Before each burn commences operators should ensure equipment is functioning properly and fix, as possible.
- Output Video Stills: if ESD, MISB 0104.5, or MISB 0601 compliant metadata cannot be associated with video, it is recommended to output video stills at a higher frequency with associated times for enhanced data integration.
- Enhance Ground Image Collection: a greater amount of ground images are required for prescribed burns. All features should be photographed as described in the GPS section above. Additionally, newer technologies like PhotoSynth™ can be used to capture fuel plots and the area around sensors. In fact, the whole plot might be captured with PhotoSynth™ using a mobile device or similar technologies. Additionally, the use of more during fire ground images that image the same area from multiple angles would be very useful. The above could help create 3D point clouds of the plots that could be compared to UAS imagery derived point clouds and provide a better characterization of plot features. All imagery should be calibrated in regards to time. Recording of synchronized time with data is essential to model validation and fire behavior characterization.
- Associate GPS with Ground Images: all ground images taken should have a GPS position recorded. Cameras or devices with internal gps can facilitate this effort. However, this does not remove the need to sometimes explicitly associate an image or set of images with a particular feature recorded using a higher grade GPS unit.
- Collect Imagery Prior to Field Sampling: collection of imagery prior to field sampling will facilitate the possibility of extracting material properties of vegetation from imagery.
Base Initial Sampling on Segmented Imagery: the pre-field sampling imagery can be segmented to allocate plot locations accordingly to ensure all fuel types are sampled. The image segmentation can then be improved based on field sampling.
- Perform Field Sampling within the Plots: pre-fire field sampling (not destructive) should occur within the plots. Simple transects can be conducted to help assess the accuracy of remote sensing classifications and provide a better understanding of plot fuels.
- Mark Sampling Plot Locations: ideally, marking the sampling plot locations with a well known point would aid in geolocation for accuracy assessments. This could present problems if the ground control effected the vegetation to be sampled. A flat item on a stake could solve the problem.
|